Pages

Saturday, June 4, 2016

Reflections

We’ve had a couple of days to sit back and reflect on Math and the Mouse 2016.  We, the professors, agree that this class was fantastic, and we are so appreciative of the efforts of these students.  The class is designed to help students explore the ways mathematics is used to not only model real-world problems but also ways in which it is used to produce solutions.  Further, we want to foster in the students an inquisitive nature and sense of wonder associated with how they view the world.  This was on display in their final projects.  In each of the projects, the students decided the focus of the project, how to collect the data for the project, and with a little help from us, how to analyze the data.  Every group decided to take on a question related to the length of time spent waiting in queues, and we will describe these projects below. 

The group consisting of Alex, Courtney, McKenna, and Johanna particularly enjoyed visiting characters during the May X.  Alex alone visited at least 17 characters over the three-week time period.  This group decided to investigate queues for characters for their project.  In particular, they wanted to investigate the lines for characters who had visible queues, such as Peter Pan and Tigger, to determine how long a guest would expect to wait.  Their analysis showed that there is a statistically significant difference in times characters spend with patrons who want 0, 1, and 2 or more autographs.  They found that on average characters spend 45 seconds with groups who want no autographs, 60 seconds with groups that want one autograph, and 80 seconds with groups that want two or more autographs.  Further, they estimated the percentage of patrons who want 0, 1, and 2 or more autographs and came up with an equation that would estimate the wait time in line based on the number of family groups waiting in front of you. 

The group consisting of Alyssa, Jamie, Zack, and Caroline were some of our most ardent fans of roller coasters, and they decided to investigate how long they would expect to wait in a special queue, called a single rider line, given a fixed number of guests in front of them.  In order to help with efficiency, Disney offers passengers who are willing to ride solo and fill in empty seats on rollercoaster trains the opportunity to wait in a single rider line instead of the regular standby queue.  The only three rides that have single rider lines available at Disney are on Rock ’n’ Roller Coaster, Expedition Everest, and Test Track.  The group decided that Test Track offered some particular challenges that precluded it from examination given the limited amount of time that they had.  So, they analyzed the single rider queues on the other two rides.  The time it takes to make it on to the ride depends on the distribution of even and odd party sizes that come through the standby line.  Their analysis showed that patrons should expect to wait 19 seconds per person in front of them on Rock ’n’ Roller Coaster and 14.5 seconds per person on Expedition Everest.  They also determined that the distribution of even and odd party sizes was not different on the two rides so that the difference in wait time can be attributed solely to increased throughput capacity on Expedition Everest, whose trains have 10 more seats than those on Rock 'n' Rollercoaster. 

The group consisting of Maria, Lindsay, Molly, and Mary Lib were curious about the benefit of getting a FastPass for certain rides.  Disney offers guests a limited number of special queue privileges during a park visit.  These privileges allow a patron to enter a special FastPass queue that bypasses most of the standby line and merges with the standby queue very near the front of the line.  The FastPass dictates an hour-long time window for the patron to return to the ride to obtain the privilege.  Further, a Disney operator controls the merge of the standby and Fast Pass lines so that preference is given to the FastPass line.  This group quickly determined, based on the speed at which FastPass guests exit the ride as compared to the standby line, that FastPasses always gave the patron an advantage and are worth obtaining.  They then changed their focus to determine when patrons show up to redeem their FastPasses so as to determine when might be the optimal time to redeem the opportunity to enter the FastPass queue.  They broke hours down into ten minute intervals and looked at how many people show up when the time ends in a 0, 1, 2, 3, …, 9.  They found that FastPasses are mostly redeemed at times when the last minute digits are 0, 4, and 9.  They concluded that since FastPass time windows start on the ‘0’ or the ‘5’ and Disney often allows patrons into the line slightly before that time window starts, that people show up and enter the Fast Pass line right before their Fast Pass time.  So, to avoid waiting in longer FastPass lines, one would want to be slightly ahead of the groups showing up when the minute digits were 0, 4, and 9.

The growth that each of these groups showed during the course of gathering data and analyzing the data was amazing.  We were impressed with all of their progress.  To celebrate the successful final projects, we went to Boma at the Animal Kingdom Lodge for one last delicious group dinner before heading to the Magic Kingdom to end the trip where it began.  

After our last group dinner at Boma


Top 10 Math and the Mouse Experiences

To finish the blog for this Math and the Mouse course, we asked the students to submit their top experiences from the course.  We’ve compiled these into a Math and the Mouse Top Ten List.

10.  The Food

Disney offers a variety of tasty alternatives, and so many of them stand out.  Most impressively was the fact that many of the students trained for and actually finished enormous ice cream cookie sandwiches from Hollywood Scoops.  
Training for Hollywood Scoops ice cream sandwiches

Further, Jamie’s one submission for top experiences was the following picture from Biergarten.  

The highlight of Jamie's trip


This was a night full of delicious German food, chicken dances, and a reminder that we’re all kids at heart as we (professors included) happily splashed our way through gigantic puddles and pouring rain when heading to the van after dinner.

Disney World (and rain storms with big puddles) bring out the kid in all of us!

9.  The Magic Kingdom “Traveling Tourist Problem” Race

The Magic Kingdom race was really fun, and the students thought it was a good way to integrate solving a Traveling Salesman Problem while still having a fun day in the parks.  Even though we didn’t win, we agree.

The professors take a twirl in the Mad Tea Party tea cups during the Traveling Tourist activity

8.  The Keys to the Kingdom Tour

This tour explores the behind-the-scenes activities at the Magic Kingdom and integrates the history of Disney into the narrative.  Most students love to go into the “tunnels” underground.  Further, the biggest takeaway from the tour was that the students won’t ever forget who Walt Disney’s brother is or what he did. Who was that man? Roy Disney.

Keys to the Kingdom tour

7.  Overcoming Fears

Many rides at Disney can be daunting, but one ride stood out as being particularly ferocious in the eyes of many students.  That ride was Dinosaur (pronounced Dino-SAAAAARRR).  It actually took several rides before some students would open their eyes on the ride.  
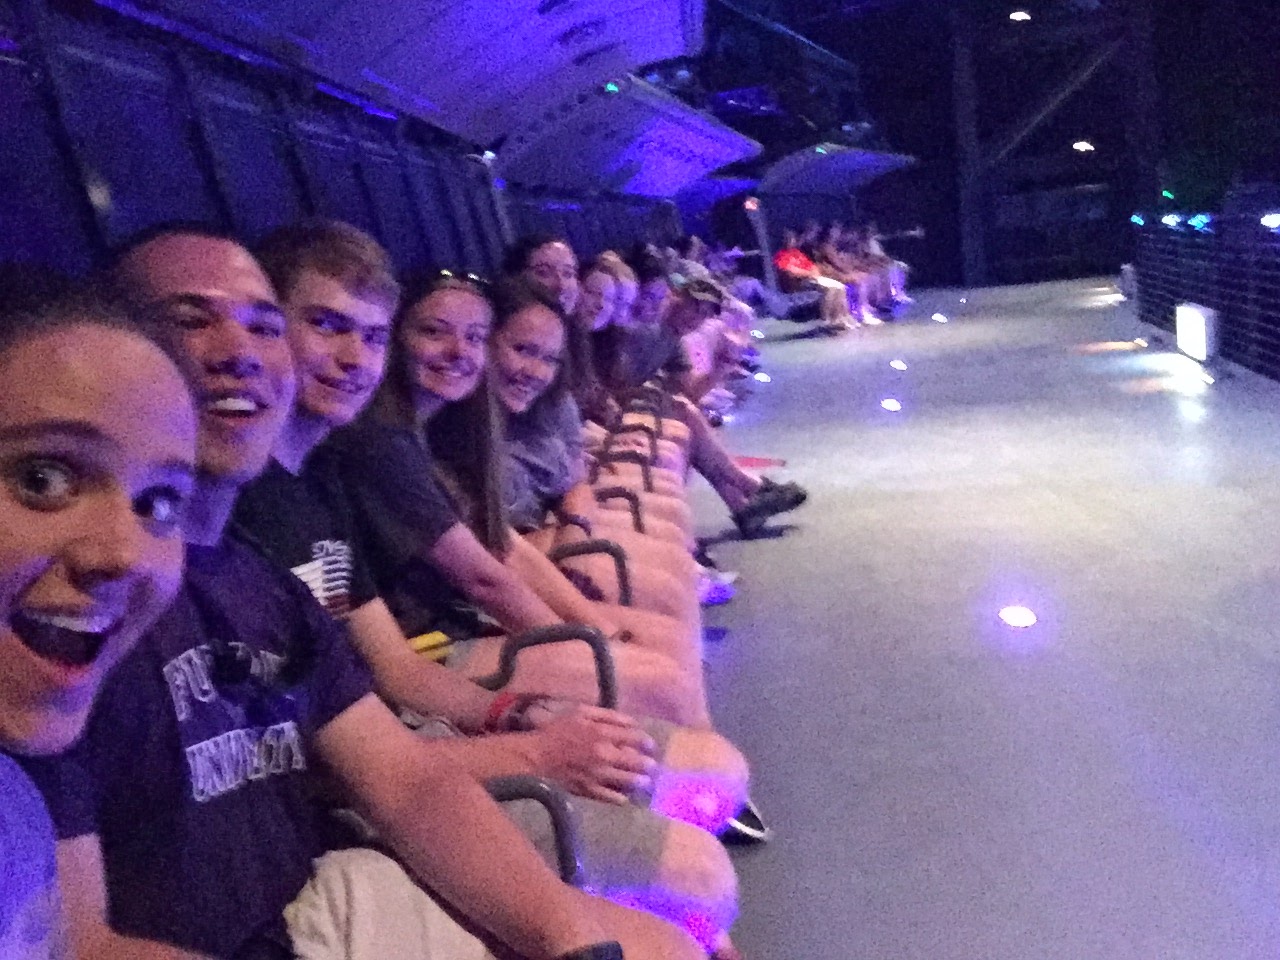
On one particular ride on this attraction, the professors thought it would be a good idea for the students to ride in one, 12-person car in order to get a group picture.  As luck with have it, the ride broke down right as the group was entering a particularly scary part of the ride.  We’ll let you judge for yourself what the reaction was based on the picture below.

Students together on Dinosaur

6.  The Shows

From Fantasmic to the Festival of the Lion King, Disney offers first-rate show experiences.  We all marvel at the technical choreography that goes into these performances.  Many students attended the same show multiple times to take it all in (and probably to sing along).  There is even a rumor that some students learned the choreography to Fantasmic and put on a “Mathmasmic” show.  Fireworks shows were also a group favorite; Wishes in the Magic Kingdom (both viewed in traditional viewing spots as well as while riding Big Thunder Mountain Railroad), Illuminations in Epcot, and Symphony of the Stars fireworks set to music from Star Wars were regularly enjoyed by all!  

Wishes fireworks

5.  Finishing the Workforce Scheduling Project

The students were able to successfully model the scheduling of employees to cover the workload for the Pecos Bill Inn & CafĂ© using data that was crafted by a Disney professional to resemble the type of data that Disney deals with each day. The task required groups to create over 250 constraints each in order to successfully model the scenario, and some students dubbed the problem ‘The Beast.’  It was beyond their abilities, but after struggling with it for four days, they got it.  It was fun to see the smiles on their faces at overcoming that challenge (taming the beast).  This project also gave a glimpse into the creativity required to develop mathematical models; all three groups were solving variations on the same theme, but the strategies employed when building constraints were all fairly different.


The students stop by to say good by to Pecos Bill on their last night in the Magic Kingdom

4.  Animal Kingdom at Night

Our course happened to overlap with the very first time that Animal Kingdom would be open at night.  It was a totally different experience at night and some of the rides took on a different dimension, particularly Expedition Everest, which seems much faster at night and gives better views of the yeti at the end.  Students (and professors) were averaging 7-10 rides on Everest during the nighttime hours.


The Tree of Life at night
Everest peering behind the show area for the Jungle Book nighttime show

3.  The Genetic Algorithm Project

This project seems to have been the class favorite.  Some students indicated that they were doubtful of the accuracy of the method at first because it relied heavily on randomness to generate solutions, but after trying out the mutations and crossovers the created, they found it cool to see how their population of solutions was actually getting better and better.  It is fun to see how a simple idea borrowed from nature can be so effective at solving hard problems.

2.  The Guest Speakers

Team Disney offered insights into what goes in to making Disney World such a magical place. They also opened the students’ eyes to the mathematics that inform their jobs every day and the possible career paths in their divisions.  Len Testa, founder and president of Touring Plans, drew rave reviews from our students for being a down-to-earth, knowledgeable, and all-other-positive-adjective person.  The fact that he shared so much about how he and his company uses math and computer science to solve problems related to the travel industry was impressive.  Students appreciated the Furman connections to Disney as well!


1.  The Payoff

This one is from the professors’ perspective.  The payoff for the decision to teach modeling is that the students can complete a difficult workforce scheduling project and talk intelligently with professionals working in Disney Workforce Management about the types of issues that arise in modeling such problems.  


Alex explains part of her group's workforce scheduling project
The payoff for teaching network modeling and search procedures (including genetic algorithms) is that they can design their own search algorithms and have a peer-to-peer discussion with Len Testa.  Len even remarked about the sophistication of the questions that they asked.  


Courtney demonstrates a network solution
The payoff for teaching queuing theory is that the students can perform a park study, analyze their results, and increase their confidence in their own abilities.  The payoff for writing a daily blog is to watch the students work together to articulate a day’s events, whether academic, technical, challenging, unexpected, or proprietary, to a broader audience.  The payoff in meeting with a variety of guest speakers is watching the lightbulbs go off when students realize that they discovered a job they didn’t know existed and would love to do.  These payoffs are the entire experience for us, and we feel honored to be able to give this experience to the students.  Thanks for a great course!

Wednesday, June 1, 2016

Math and the Mouse by the Numbers

As we reflect on our time here, we thought we'd pass along some data on the types of experiences we've had during Math and the Mouse.  We'll have one more blog post after this to report on our last day in the parks and final group projects, but for now we'll give you a look at our May Experience by the numbers.
  • 12 Furman students
  • 3 Furman professors
  • 3 vans (including one van swap)
  • 1 flat tire
  • 11 math courses' content represented
  • 12 majors/programs/minors represented (Applied Math, Math, Math-Econ, Physics, Chemistry, Pre-health, Economics, Spanish, Health Sciences, Information Technology, Music, Latin American Studies)
  • 10 guest speakers (including one current Furman student and one Furman alumna)
  • 60 hours spent on a backstage tour
  • 7 unique group projects
  • 4 engaged learning activities
  • 11 Lightboard videos viewed by students
  • 13 learning modules led by faculty
  • 70 dice used in Liar's Dice competition
  • 732 constraints in Workforce Scheduling project
  • 284 minute fitness for shortest genetic algorithm project
  • 206 final project data observations
  • 712 minutes for winning group to complete Traveling Tourist Problem
  • 520 utility points in the winning group's (a.k.a. professors') Hollywood Studios "knapsack"
  • 8 pairs of Chacos sandals worn
  • 6 Kavu bags toted around
  • 36 Comfort Colors shirts worn
  • 6 sets of mouse ears worn

  • 22 "We're Celebrating" buttons worn (and possibly lost or smudged)
  • 20 consecutive days in Disney Theme Parks, including 8 days visiting Magic Kingdom, 5 days visiting Epcot, 8 days visiting Hollywood Studios, and 6 days visiting Animal Kingdom (the sum of which exceeds 20 thanks to park hopping)
  • 7 different MagicBand colors -- 5 (Furman) purple, 4 blue, 2 pink, 1 red, 1 yellow, 1 green, and 1 orange

  • 15,250 average steps taken daily by each person
  • 7 miles walked daily on average
  • 85% chance our most "randomly selected" student would be asked to go through the metal detectors at park entrances
  • 8 rope drops
  • 58 unique attractions visited
  • 80 minutes waited in the longest line (a single rider line, no less)
  • 26 Dole Whips consumed
  • 7 students ate an entire Hollywood Scoops ice cream sandwich by themselves
  • 102 characters visited
  • 1453 PhotoPass pictures taken
  • 38 African safaris
  • 296 expeditions to Everest
  • 41 missions to space
  • 253 rides in a super-stretch limo to an Aerosmith concert across town
  • 118 trips on Big Thunder Mountain Railroad
  • 30 flights Soarin' over California
  • 999999 high score on Buzz Lightyear Space Ranger Spin
  • 277,500 Toy Story Mania high score
  • 31 Hollywood Tower Hotel service elevator rides (maximum by a single person) plus one traditional elevator ride after ride evacuation and one fire alarm
  • 5 rebel spies
  • 61 plunges into the briar patch
  • 144 hitchiking ghosts
  • 2 royal guards for Belle
  • 7,981 = Sum of all thrills
  • 44 presidents introduced individually with full names in the Hall of Presidents
  • 13 group monorail rides
  • 5 group ferry rides
  • 64.9 maximum speed of any ride in WDW (in miles per hour)
  • 1,065 FastPasses used
  • 2 indoor roller coaster interiors seen with lights on
  • 2 ride evacuations
  • 16 Beverly samples
  • 13 days where fireworks were seen
  • 12 student maximum capacity of oversized Twistee Treat chair
  • 1 luau stage performance by a participant
  • 7 chicken dances performed at Biergarten
  • 1 student attacked by a crane
  • 1 Cars-themed birthday party
  • 5 royal chariot rides exceeding 26 hours total
  • 1800 views on Furman's Snapchat
  • 15 stickers peeled off the ground
  • 1 official Disney custodian badge earned
  • 20 golden FastPasses
  • 5 times bobby pins saved the day
  • 4 students moved to tears by the story of Roy Disney
  • 29 conversations with strangers about math/our class
  • 9 sing-a-longs
  • 7 childhood memories reenacted
  • Infinite memories made

Monday, May 30, 2016

The Genetics of Touring

Each student has written three blog posts at this point, so it's now the professors' turn to take over! Yesterday, we started the day with an optional trip to Hollywood Studios to allow students to collect project data. Unfortunately, the park had Extra Magic Hours that morning, so WDW resort guests could enter the park an hour before we could, which made for long lines early in the day. After some time to work on projects back in the hotel in the afternoon, we headed to Animal Kingdom to enjoy another evening in the park. 

The Genetics of Touring
Last week, the students participated in a race to see which team could accomplish a list of 19 tasks in the Magic Kingdom most efficiently.  The tasks ranged from riding an attraction to getting a picture taken with a character.  Differing from the Traveling Tourist Problem at Epcot two years ago, we allowed teams some flexibility in the attractions that they visited.  Here is a list of possible events:

The winning group's tour of the Magic Kingdom.
Required                                
Space Mountain       
Buzz Lightyear’s Spin            
Seven Dwarfs Mine Train 
Dumbo   
Haunted Mansion 
Peter Pan’s Flight           
Under the Sea - Voyage of the Little Mermaid
Splash Mountain              
Big Thunder Mountain Railroad
Pirates of the Caribbean           
Jungle Cruise         
Group Photo with a costumed character  
Group Photo with Walt Disney 

Fantasyland (Pick 3)
It’s a Small World
Winnie the Pooh
The winning group, Zack, Mary Lib, and Johanna.
Mad Tea Party
Hall of Presidents
Enchanted Tales with Belle
Barnstormer
Prince Charming’s Royal Carousel
Mickey’s Philharmagic

Tomorrowland (Pick 2)
Astro Orbitors
Stitch’s Great Escape
Monster’s Inc. Laugh Floor
Carousel of Progress
Tomorrowland Speedway

Adventureland (Pick 1)
Magic Carpets of Aladdin
Country Bear Jamboree
Enchanted Tiki Room

The students were assigned into groups of three and were given data on the expected wait, walk, and ride times in the Magic Kingdom that day (supplied by tourningplans.com).  They had an afternoon to design a tour of the chosen 19 attractions and were allowed time in the park to perform reconnaissance.  The following day we raced, and (drumroll, please) the winning team was Johanna, Mary Lib, and Zack who finished the tour in just under 6 hours.  Their tour is shown above.

Johanna, Mary Lib, and Zack flying with Dumbo.
After the race, the students learned to model the problem using networks and also learned that the problem they were trying to solve is a variation of the Traveling Salesman Problem.  This problem of trying to find an efficient tour of a given list of locations is one that is researched by logistics companies like FedEx and UPS.  A variety of algorithms exist to try to produce optimal, or near-optimal, solutions to these types of problems.  One such method is to use what are known as genetic algorithms.  These algorithms mimic natural selection in that a variety of solutions are produced (called a population) and their tour length (called their fitness) are calculated.  A solution for this problem is just a sequence of attractions in the order that they are visited (called a tour).  Solutions are then subjected to one of two types of operations to produce new, child solutions.  The first type of operation is called a mutator.  These operators take a member of the population and augment it in some way, such as switching the order in which you visit two (or more) attractions.  The second type of operation is called a crossover operator.  These operators take two members of the population and produce a child that resembles both parents.  For instance, a crossover operator might take two members of the population and find the attractions that are sequenced in a common position in both parents and include those attractions in those positions in the child.  The remaining attractions are then randomly placed in the remaining sequence positions in the child.  Every time a child is produced its fitness is calculated and if it is better fit than the least-fit solution in the population, that child replaces the least-fit solution in the population.  These operations reoccur for a fixed number of iterations (usually quite large) and the most-fit solution from the population is chosen as the “optimal” solution. 
The winning group at the finish line and
home of Dole Whip, Aloha Isle.
The second project for the students in the course involved inventing mutators and crossovers for a genetic algorithm to find the optimal solution of an abbreviated Traveling Tourist Problem involving only ten rides.  In fact, the example mutation and crossover operators described above are ones that students came up with.  Here are examples of other inventive operators that the students generated.

Crossover Example
  1. Define Parent 1 as the parent with the single highest wait time.
  2. Find the sequenced attractions that match in P1 and P2.  Include these attractions in these sequenced slots in the child.  Then take P1’s highest non-matching wait time and swap it with other attractions until it is in the location in P2’s sequence of the highest non-matching wait time.
  3. Continue to find a nonmatching ride whose wait time is the highest and switch it with the lowest remaining wait time of the other parent. 
Mutator Example (Frame Shift)
Move an attraction from sequence spot j to sequence spot k and then shift all of the attractions in between sequence spots j and k one slot to the right or left depending on j’s relative position to k.

After running their genetic algorithms on the subset of rides that they were given, the group consisting of Johana, Mary Lib, Alyssa, and Molly found a tour that could be traversed in 284 minutes.  The sequence of attractions in this tour was
  1. Seven Dwarfs Mine Train
  2. Peter Pan's Flight
  3. Haunted Mansion
  4. Jungle Cruise
  5. Buzz Lightyear
  6. Dumbo
  7. Space Mountain
  8. Splash Mountain
  9. Pirates of the Caribbean
  10. Big Thunder Mountain Railroad
After studying these genetic algorithms, our group met with Len Testa, President of Touring Plans and co-author of The Unofficial Guide to Walt Disney World, which has sold more than 4 million copies worldwide.  Testa’s company, Touring Plans, employs an analytic approach to travel, helping its subscribers not only find good park tours, but also finding affordable options for park tickets, finding the quietest hotel rooms, etc.  His company employs mathematicians, statisticians, and computer scientists to model and produce solutions to many problems related to travel.  Len spoke with our students about the evolutionary algorithms (such as genetic algorithms) that his company employ to produce tours for users in a quick amount of time.  The time that the students put into to developing an intuition about the problem and creating mutation and crossover operators paid off when they saw how Touring Plans employs these types of algorithms to produce solutions to real-world problems.  They came away with an appreciation for the mathematical sophistication that Touring Plans brings to their solution approaches.  For some students this was an experience that caused them to remark that they wished they had brought a resume to the talk to give to Testa.  For the professors, we give many thanks to Len Testa for inspiring a group of students to continue to develop their mathematical creativity and problem-solving skills to make a difference for others. 

Saturday, May 28, 2016

Day 18: Soarin' Through the Day

We're Soarin', Flyin'
Hi everyone, Caroline and Courtney here! Even though we had a late night last night celebrating Animal Kingdom's first night opening, we got up early for rope-drop at Epcot for one reason: the reopening of Soarin'. The popular simulation attraction has been closed for renovations, but reopened this weekend with an updated version of its former California-themed show. The final update will be titled Soarin' Over the World, and will showcase sights from around the world. Shoutout to Dr. Bouzarth for getting us FastPasses and noticing that it would be open today! We were able to ride the attraction once right when the park opened, and again using our FastPasses, and I was very impressed. While it isn't as "thrilling" as some other attractions, the entire simulation is beautifully done.
A selfie with some of the students before Soarin'
The Mouse Himself
In between our two Soarin' expeditions, we took a quick detour to the Character Spot in Epcot. We got to meet Mickey, Goofy, and Minnie, and loved getting to interact with the characters. Goofy seemed to particularly like one member of our group.


Goofy really like Mary Lib!

We made all the guys take a picture with Minnie!
One Day, Two Parks

After our flights at Epcot, we made the trip to Magic Kingdom so that one of our independent project groups could collect more data. When we arrived, my group (Caroline), ate a quick lunch at Casey's on Main Street before heading towards Liberty Square and Frontierland. After missing the showtime for the Hall of Presidents, Dr. Hutson thought it would be a good idea to take some of us to Country Bear Jamboree. I will only say that it was a memorable experience where we also got to see some of the earliest animatronics at Disney World. After helping the Fastpass group collect some data, a few other students and I went back to Main Street for some souvenir shopping.

My group (Courtney) grabbed some food at the Colombia Harbour House then headed to Big Thunder Mountain to gather some data. Since we were only focussed on one ride, not all twelve students were needed to collect data. Therefore, we decided to go to see The Enchanted Tiki Room for the first time this trip. There were some mixed reactions, especially since the song can get stuck in your head throughout the entire day. However, I personally believe that it is a classic that you have to do once every time you go to Disney.

Some Math with our Mouse
Back at the hotel, we began analyzing our data for our independent group projects. My group (Caroline) is looking at the Rock n Rollercoaster and Expedition Everest single rider lines. Disney utilized single rider lines to make their rides more efficient, as they can even out an odd party with an individual. We are trying to analyze their efficiency while also comparing the two lines. By counting party sizes as well as wait times for both of these attractions, we have been able to track the efficiency of the single rider line. We have established a hypothesis for how fast the single rider lines should be moving for each attraction, and plan on testing it tomorrow.

My group (Courtney) spent the past few days gathering data on the Disney characters guests can meet in each park. We continued to organize our data today by the 12 different characters that we observed. We arranged the data further by looking at the time characters spent with guests to analyze the number of autographs that the characters signed from 0 to 2 or more and how this affected the time they spent with each guest. Our second half of our project looks at the number of people a character can visit within 30 minutes. We recorded the party sizes seen by each of the 12 characters to find how many people each character could see a 30 minute time span. We are looking to determine whether the number that a Disney cast member gave us, which was 80 people in 30 minutes, could be correct.
We finally got a good group picture with Mickey!

Illuminated for the Last Time
For the last time, our group went to Epcot to enjoy a delicious dinner and fireworks. When we arrived at the park, some of us went souvenir shopping and exploring at our favorite pavilions, while others took the opportunity to journey to Mars one last time. We had a great dinner at Nine Dragons. Right after dinner, we caught our last viewing of Illuminations, the Epcot firework and light show. It was just as dazzling as it was the first time, and we left the park with nothing but great pictures and memories!
Written by:
Caroline
Courtney


Day 17: Just Look at the Time!


Posing together outside one of our
group's favorite rides, Tower of Terror. 
What do Midway Mania, Markov Chains, Mission Space, and matrices all have in common? They're all integral parts of our magical studies here at Math and the Mouse! Mickey and Minnie Mouse have helped us explore mutations, modeling, mapping, and more - you wouldn't believe how much math can be found from observing the Mary Poppins line, watching MuppetVision 3D, and even riding Mad Tea Party or exploring the Maharajah Jungle Trek! We've enjoyed all of our time and studies in each of the four parks (although, if they have to choose, Molly and McKenna say that their personal favorite park is Magic Kingdom) and it has certainly been a marvelous, mathemagical, and alliterative May X! And today's update on our group's latest adventures is brought to you by Maria and Mary Lib!

Hollywood Studios
This morning we arrived in Hollywood Studios for rope drop! We started our day off at Midway Mania and Tower of Terror, and then continued collecting data at Rock ‘n' Roller Coaster. As mentioned in previous blogs, a couple of the groups are interested in Rock ‘n' Roller Coaster for various research reasons: one group is looking at the efficiency and worth of the FastPass, while the other is concerned with the value of the single rider line. While standing outside the ride itself, we collected entrance and exit data in 15-minute intervals, which will help us determine arrival and departure rates of the ride. While in line, groups recorded data such as the times group members entered the ride, when the FastPass and Standby lines merged, non-single rider line party sizes, when group members boarded the ride, how far apart each consecutive boarding time was, and when each group member exited the ride.


We were so lucky to have had the opportunity to meet
 with a Disney engineer this morning!
After collecting data, we reconvened as a group in front of Rock 'n' Roller Coaster at 11:00 AM to meet with an electrical engineer for Disney that has a family connection to Furman. He talked to us about the mechanical operation and troubleshooting of two park headline attractions, Rock ‘n’ Roller Coaster and Tower of Terror, as well as a few others. Everything he discussed was very interesting, and one of the highlights of his talk was his discussion of the random sequencing of Tower of Terror and Star Tours. Although it’s not obvious, each ride on Tower of Terror and Star Tours is not the same every time. Tower of Terror has a set of possible drop and rise sequences, and one of these is randomly selected for an elevator each time it runs. In a similar manner, the ride sequence for Star Tours is randomized, where each ride includes four of the thirteen possible segments. The random sequencing of both attractions allows for a unique and surprising experience for guests, even if they have ridden the rides repeatedly. Just another example of Disney going above and beyond!

After meeting with our guest speaker, we left the parks and the professors treated us to lunch - the break from PB&Js was greatly appreciated by students! The Chipotle and Panera Bread near our hotel are within a few feet of each other, so we split up and reconvened back at the hotel to eat together.

The Physics Behind Disney World
This afternoon in class, we were able to look more closely at the application of science in Disney World; specifically, we learned more about the physics behind the park.  Dr. Bouzarth gave a very interesting presentation that overviewed some fundamentals of physics and ways that they apply to the operation of Disney - this connected very well to our session with the guest speaker this morning, as we were able to explore in even more depth several ideas that he had discussed.  In the context of discussing such ideas as force, energy, magnetism, and Newton's laws of motion, Dr. Bouzarth helped us to make connections between these concepts and the park operation.  For example, we discussed the Test Track ride in Epcot, which our guest speaker had told us was the fastest ride among the four Disney World parks, in light of the idea of energy transfer.  We also learned that Rock ‘n’ Roller Coaster (the second fastest ride in the park) is able to accelerate from 0 to 57 miles per hour in less than three seconds because it utilizes more than 100 electromagnets which are underneath the tracks.  The quick acceleration is one of the signature features of the ride and one that we have all experienced, and it was interesting to learn more about how it actually works!  We finished the lesson by reviewing limits, derivatives, and integrals (concepts that we had all covered in calculus) and their applications to calculating position, velocity, and acceleration of objects.   

Animal Kingdom After Dark!
After riding Everest seven times tonight, we became pros
at having fun with the coaster's camera!
After class this afternoon, we left the hotel at 4:30 PM and headed to Animal Kingdom - this was very exciting, as it had been almost a week since we were in this specific park.  Also, today was an unusually special day in the park - for the first time ever, Animal Kingdom was open until 11:00 PM (a big difference from its traditional 6:30 closing time)!  Tonight was also the unofficial premiere (or “soft opening”) of the Jungle Book show in Animal Kingdom, so there was an extra amount of excitement within the park this evening which only added to the fun of the atmosphere. Once we had arrived at the park, our entire class rode the Dinosaur ride, a thrill ride that takes groups of 12 on a dark and bumpy journey through a path filled with a variety of moving dinosaur figures.  All of the students in our class were able to fit on the same car, which turned out to be quite the adventure!  The ride, which can be fairly unnerving at the best of times, became extra scary today when our class got stuck on it, and we were in complete darkness for what seemed like quite a while (though probably was only about two minutes).  After this unexpected adventure, the group had free time to visit other attractions in the park and to continue collecting data at Expedition Everest for the single rider line project group. We also had evening FastPasses for the Kilamanjaro Safari; while we had done this safari once before in the daytime, it was an even more fun activity around dusk, and we were able to see a wide variety of animals.  

Tonight definitely had the shortest wait times for rides we have ever experienced in any of the parks, and as a result we were able to ride Kali River Rapids five times and Expedition Everest seven times over the course of the day!  Undoubtedly, one of the highlights of the evening was getting to ride Expedition Everest at night.  Although approximately half of the ride takes place indoors and the other half takes place outdoors, the darkness outside made the ride transitions feel even more seamless than usual - plus, it was extra fun to know that we were some of the first park visitors to get to ride the coaster at night! After closing out the evening by riding Everest as a class for five consecutive times, we headed out right at closing at 11:00 PM.

Looking Ahead
Tomorrow, we will be heading to Epcot at 9:00 AM for rope drop and will spend the afternoon continuing some FastPass data collection in Magic Kingdom.  On Sunday, we will be back in Animal Kingdom for part of the day - and we also have FastPasses to see the Jungle Book!  While we’re certainly sad that the trip is coming to a close, we are doing our best to enjoy every minute left and we know that there is definitely still much more excitement ahead!         

Written by: Maria Bartlett & Mary Lib Saine


Thursday, May 26, 2016

Day 16: Happy Happy Birthday

Hey guys, its Alyssa and Zack blogging our way through day 16 of our 21 day adventure. Today we had some choices for our morning activities (Animal Kingdom or sleeping), a birthday party, and spent the night in Hollywood Studios.

Morning Choices


This morning our group had the choice to be early birds and go to Animal Kingdom for rope drop or to act like Sleepy at the hotel.


We both chose to arrive at rope drop, we saw the pre-show for opening the park where a flock of brightly colorful parrots flew over us. We were able to ride Expedition Everest three times, Primeval Whirl, and Dinosaur in about an hour and a half. Time well spent if you ask us! Three of the four students that chose to go to the park this morning are working on the single rider project, collecting data to compare the single rider lines of Expedition Everest in Animal Kingdom and Rock 'n' Roller Coaster in Hollywood Studios. We found that Everest's single rider line is easily observable while you are in it and we gathered a large number of data points to use in our project.

Birthday Cake Time!


After our morning adventure it was time to celebrate Dr. Bouzarth’s son’s birthday! William turned a whopping four years old today, and we had a Cars themed birthday bash full of cake, gifts, and festive party hats.


After the party we met to sort through all the data we had been collecting for the past few days. Each group met to evaluate the data they had, look for potential anomalies or patterns, and establish marching orders for tonight in Hollywood Studios. 

Our group is still playing with different hypotheses we might test once we finish data collection. One thing we've found interesting is that Rock 'n' Roller Coaster and Expedition Everest both have two people per row, but the single rider lines move at different speeds. There are many obvious reasons, such as larger train capacity at Everest, but it is evident that Rock 'n' Roller Coaster's single rider line takes more time to go through.

Hollywood Studios


After we made it to Hollywood Studios, project groups split up to collect data in the park or ride a few rides before dinner at Backlot Express. Dr. Harris and Dr. Hutson tried out the newly opened third track on Toy Story Mania and gave positive reviews of it. The FastPass project group worked on Rock 'n' Roller Coaster, collecting data on the relative speeds of the FastPass and standby lines and the number of riders entering each line. Working on the character meet project, the third group of students gathered data from the Disney Junior characters.

We met for dinner at Backlot Express where I (Alyssa) got the opportunity to fight the dark side by eating a Darth Vader waffle. After dinner we split up again to collect data and ride some more attractions. Our group worked on counting party sizes at Rock 'n' Roller Coaster. I (Alyssa) also ran into one of my Furman friends Elise, who went to all four parks in one day! 

Since Hollywood Studios closed at 8:30, we had time to stop at Twistee Treat and eat some delicious ice cream. We returned to the hotel with enough time to enjoy the pool before resting up for the fun that awaits us tomorrow. We are headed right back to Hollywood Studios at rope drop for data collection and a guest speaker!

Sitting in the (medium sized) giant chair.

Written By: Alyssa Ciurlik and Zack Miller